Wednesday, 27 July 2016


IFFM Blog 3. Capital Asset Pricing Model (CAPM) and Portfolio Theory

                                                   Gan Kian Siong ID No: 14045693  Date: July 27, 2016 


Introduction of CAPM
CAPM is an idealized portrayal concept for the corporate financial management to measure the cost of equity and to rhetoric, shareholder expected to maximize returns (Frederikslust, Ang, & Sudarsanam, 2008). The process of using CAPM is to determine a required rate of return, on justifying an asset to a well-diversified portfolio, considering that assets are the non-diversifiable risk. Whereby its application could determine the expected returns on capital investments. 

Based on the Nobel prize winner William Sharpe and other theoreticians, named as one of the most reputable financial theory has reigned the rigor academic influence since the first has introduced in the 60s. It is commonly by financial managers or financial institution to use CAPM model or Gordon growth model as a supplementary tool to estimate the financial market price securities, in an attempt to develop realistic and useful cost of equity calculations. The model provides a methodology of translating the velocity risk would be critically evaluated. but no longer enough to rely on standard deviation (Arnold, 2013).

CAPM limitations
While CAPM is accepted academically, there is empirical evidence suggesting that the model is not as profound as it may have first appeared to be. CAPM principle although often as the result is subjective and its application continues in stern vigorous debates in the rigor academic disparity against the real financial market practices (Levy, 2012). Despite limitations, the theoretical representation of the CAPM could be useful as an analytical toolkit but not necessarily applicable for a financial manager to use as a vital decision tool. Perhaps below are some assumptions can be commendable as follow.

Firstly, a financial market populated by the advance high speed sophisticated technological system, with information available, investors are well-educated, well-trained to perceive the financial market risk and able to transform it into expected return. Secondly, assumption distinguishes modern investors who care about wealth and profits more to less (profit taking) to reposition it portfolio and look out an opportunity for its portfolio diversification. Thirdly, the hypothetical investors of modern financial theory demand a premium in the form of higher expected returns for the risk of volatility assets with acceptable tolerance. Table 1 illustrates the efficient frontier concept.

Table 1. Source: Adapted from Levy Haim, 2012. The CAPM model in the 21st Century

Measuring Beta in different period
β – Beta – Beta is a measure of stock’s daily volatility and compares company’s share price reacts the overall market as a whole in price movement (Arnold, 2013). For an instant, company share price is sensitive when market reacted to the news with overbought, oversold before it shares price stabilize. Table 2 with three examples, show the deviation involved in obtaining a historical beta are direct and straightforward. However, every individual investor has different preference to decide the period that which frequency is more appropriate to use "daily", "monthly (table 2.1)", "yearly (table 2.2)", or "5 years (table 2.3)" data sources as the base set up for their investment approach. Regardless the period is adopted; each information provides a different estimate of beta deviations.   

Table 2.1 Source: Bloomberg.com. Estimate of Beta - "Monthly" Chart Data. 
Table 2.2 Source: Bloomberg.com. Estimate of Beta - "Yearly" Chart Data. 

Table 2. Source: Bloomberg.com. Estimate of Beta - "5 years" Chart Data. 

Perfect Capital Market
CAPM theory is based on Perfect Capital Market that may not be applicable for such cluster of investors with high-risk takers behavior (Levy, 2012). For example, the true assumption of the model lies not just in the reasonableness of its underlying market perfection theory but also in the validity and application of the model’s prescription. Tolerance of CAPM’s model allows the derivation of a concrete, though the idealized manner in which financial market measure risk velocity and transfer it into expected return (Elbannan, 2014).  Lastly, financial theory defines risk as the possibility that actual return will deviate from expected return, and the degree of potential market volatility fluctuation determines the degree of risk. Table 3.


Table 3. Source: Adapted from Haim Levy, 2012. The CAPM in the 21st Century.

The model is an extension of the earlier work of Harry Markowitz on diversification, along with Merton Miller for their further contributions to CAPM-based theory (Elbannan, 2014). The assumption of capital market apply to the basic theory are perceptibly unrealistic in which the international financial market measure risk and transform it into required rate of return (Mullins, Jr., 1982).

The assumption in the perfect capital market theory were made known as are; all investors are risk averse by nature, investors have same period to evaluate market information beyond fundamental or technical analysis, there is unlimited capital to borrow at the risk-free rate of return, investment can be divided into unlimited sizes, there is no taxes or no tax exemption require, inflation or transaction costs (Elbannan, 2014). Nonetheless, due to these prescriptions, investors choose mean-variant efficient portfolios. All these assumptions were radically not aligned with the modern financial market practices. In which, by rectification investors seek to minimize risk and maximize return for any given level of measure risk tolerance and acceptance (Levy, 2012). 


Difference between Capital Market line (CML) and Security Market Line (SML)
The CML is a line that measures the level of risk through standard deviation, or through a total risk - free rates of return a specific portfolio. The line graphs define efficient portfolios. While the SML measures the risk through beta, and the Line graphs define both efficient and non-efficient portfolios, which representation of the market’s risk and return at a given time (Arnold, 2013).

CML relationship between risk and return for a fully diversified investor, the investor would understand the CML and SML to manage those portfolio while spread the risk in the share investment (Arnold, 2013). The alternative risk and return which parallels in line lie on the straight line. A positive linear effects associated with an example illustrate in table 5, these can be found in all types of portfolio clusters includes without oil (table 5 “X”) and with Oil portfolio (table 5 ”Z”), without oil portfolio includes bonds, property, retail, technology and S&P 500 stocks etc.

In CAPM discipline, the relationship between risk as measured by beta and expected return is shown on the left side illustrate in Table 5  (“Y). Based on the CAPM theory all security lie on the security market line, the SML position being determined by the Beta (Arnold, 2013). These are the shares that are not in equilibrium, the higher level of return for the risk, the investor has to absorb the market consequence.  If a higher rate of return portfolio is required, the investor is to take the full risk.    
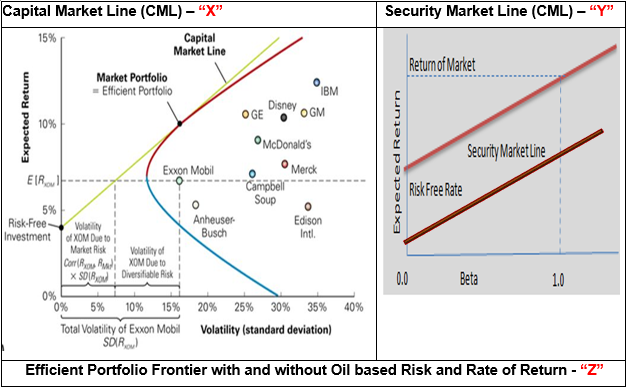
Table 5. Source: Adapted from (Levy, 2012, Elbannan, 2014) The CML and SML

The Efficient Market Frontier (EMF)
The EMF is a modern portfolio theory tool that shows investors the best possible return, the set of optimal portfolios that offers the highest expected return for a defined level of risk or the lowest risk for a given level of expected return with the stock daily volatility investor willing to absorb (Frederikslust, Ang, & Sudarsanam, 2008).

Table 6-A example illustrates the portfolios that cluster to the right of the efficient frontier are also sub-optimal because these have a higher level of risk for the defined rate of return, the outlook of the efficient frontier is curved, rather than linear. (highlighted cycle in red = Risk portfolios)

Table 6-B further explained that if an older investor who are risk averse, they prefer less riskless return portfolio want to allocate the majority of their portfolio to bonds or mutual funds and allocate a smaller portion of the capital to other asset classes. On the other hand, for a younger investor with higher risk tolerance, they are more willing to take high-risk return want to allocate the majority of their portfolio to stock with max various sector and industries.   

Table 6-C show a concept between high and low risk and return portfolio combination and diversification of stock and bond allocations that dependent on investor preference.   

Table 6 – C Portfolio Combinations – Diversification of capital allocation between stock and bond or mutual funds

Type of Risk – Systematic / Unsystematic

Systematic risk - involves overall market risks, these are the type of risk factors cannot be diversified at the broader way which associate with political or government policy changes, has a direct adjustment on interest rates, exchange rates, and technical recession are an example in shown in table 7. (MSCI Index Research, 2013).   

Unsystematic risk – these are classified specific risk involves in an industry and company stock announcements, the massive investors can diversify away of their stock invested portfolio when a vast deviation of the share price volatility causes stock price corrections due to panic selling (MSCI Index Research, 2013).  

Table 7. Source: Adapted from MSCI Index Research, 2013.

Nevertheless, these risk factors are the crucial element in part of CAPM model, investor could estimate the rate of return of the stock valuation, it can work out the various possibility of the discount rates to be used for stock appraisal and make a decisive judgement on the performance of an investment strategy in the capital markets. Examples using Citigroup Inc. (Table 8-A) and SIA Limited (Table 8-B), shows that the stock over a year period with correlation risk types involves systematic (with portfolio diversification) and unsystematic portfolio (un-diversifiable) risk. There is similar real case appear in the different industries or sectors. E.g. Bank of America, JP Morgan, SIA, etc.     


Table 8-A. Source: Nasdaq.com Citigroup Inc. Stock Chart July 26, 2016

Table 8-B. Source: Yahoo Finance, Singapore Airline Ltd. Stock Chart July 26, 2016

References


1)    Arnold, G. (2013). Corporate Financial Management . Person.

2)    Elbannan, M. (2014, December 25). The Capital Asset Pricing Model: An Overview of the Theory. International Journal of Economic and Finance, 7. doi:10.5539/ijef.v7n1p216 Frederikslust, R., Ang, J., & Sudarsanam, P. (2008). Corporate Governance and Corporate Finance. Routledge.

3)    Levy, H. (2012). The Capital Asset Pricing Model in the 21th Century. Cambridge University Press.

4)    MSCI Index Research. (2013). Foundations of Factor Investing .

5)    Mullins, Jr., D. (1982, From the January Issue). Does the Capital Asset Pricing Model Work? Harvard Business Review.


Monday, 25 July 2016


IFFM Blog 1. International Value Management              Gan Kian Siong ID No: 14045693
                                                                                                                      Date: July 25

The concepts of Value Based Management (VBM)
VBM is a managerial approach in which the primary purpose is to focus on long-run shareholder wealth creation. The objective of the firm corporate governance, business strategy, corporate finance, operation excellence and corporate culture drives continuous improvement efforts guiding objective toward shareholder wealth maximization. (Arnold, 2013). VBM determine how a company use them to make both major strategic and day to day operational decisions at all levels in an organization.

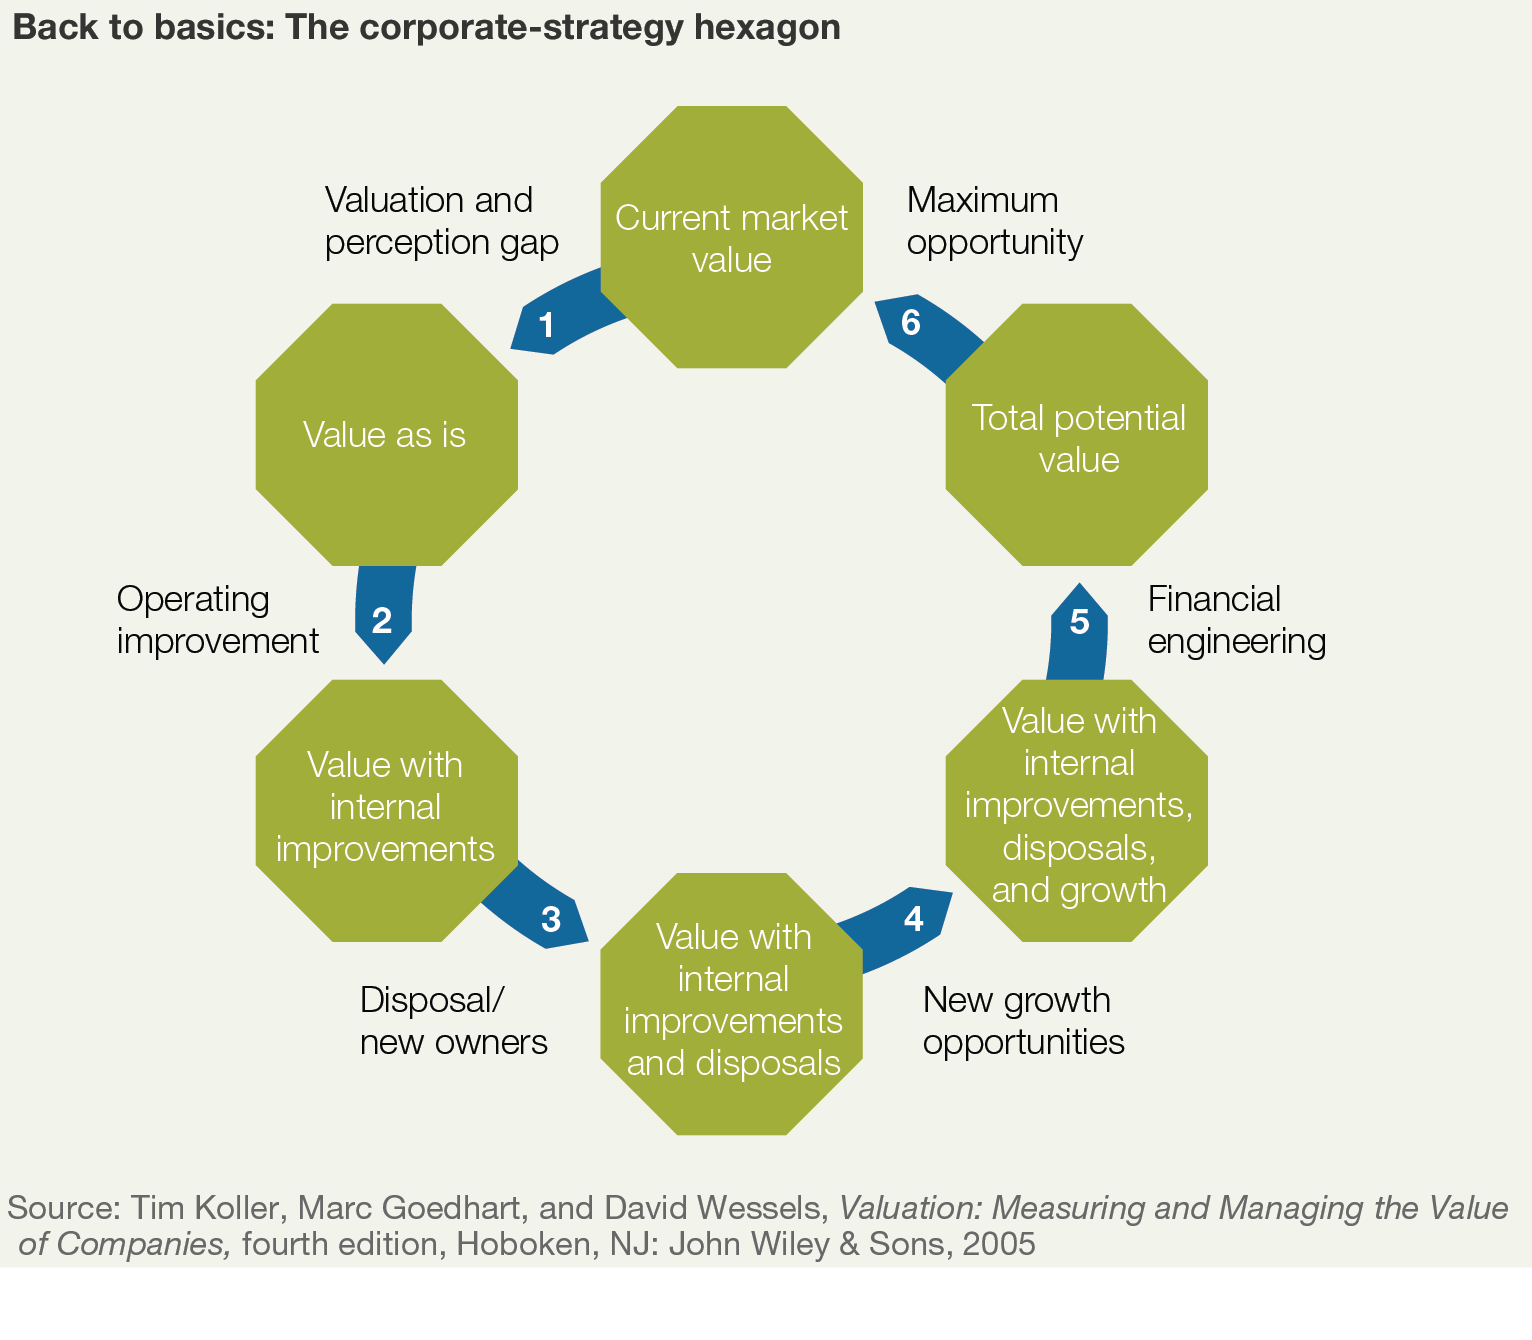
The value of a company is determined by its discounted future cash flow. Value is created only when companies invest capital at required returns that exceed the cost of capital (Jacobs & Shivdasani, 2012). It recognizes that top-down strategy command-and-control structures cannot work well alone, especially in large MNE who owns various sites in the global footprints, each of their core functional location has given a set of capital allocations (SG&A) to run their operations. Table 1 illustration the flow measuring the value cycle of a company. It entails managing the balance sheet as well as the income statement and balancing long and short-term business perspectives (Koller , 1994) .

Table 1. Source: McKinsey & Co. Tim Koller, Marc Goedhart and David Wessels. 2005

The important of Intangible Value
Companies also need non-financial intangible goals involves the management team— beside focusing a shareholder value driver to ascertain its capital disciple for long-term perspective, each domestics stakeholder is empowered in taking the concerning between customer satisfaction, product innovation, employee welfare and cultures, employee satisfaction, mitigating risk in operational excellence and long run stock returns (Edmans, 2011, Koller, et al., 2010) Table 2. For example, to inspire and guide the entire organization of good corporate governance practice is absolute essential. Such objectives do not contradict value maximization. Nonfinancial measures must, however, be carefully considered in light of a corporate’s financial circumstances (Rappaport , 2006). 

Table 1. Source: Adapted from Mckinsey & Co.  Framework of Shareholder Value Creation

Short brief on Time value of Money
In view of the financial and investing perspective, one of the key important factors is the time value of money over-time (Drake & Fabozzi, 2009). For an instant, a company evaluating the financial capital structure to determine the cost of capital for an estimate expected return to the investment of equivalent risk, the concern about what a future cash flow is worth today (PWC, 2013). The complexity of time value of money which, a dollar today the value is not worth tomorrow or years to come (Drake & Fabozzi, 2009). Moreover, any amount of money promised in the future is uncertain due to the economic conditions and political reasons affecting the demand and money supply could lead to inflationary or deflationary disorder, and the value of the future money remain inconsistent from time to time. 

Short brief on Future Value
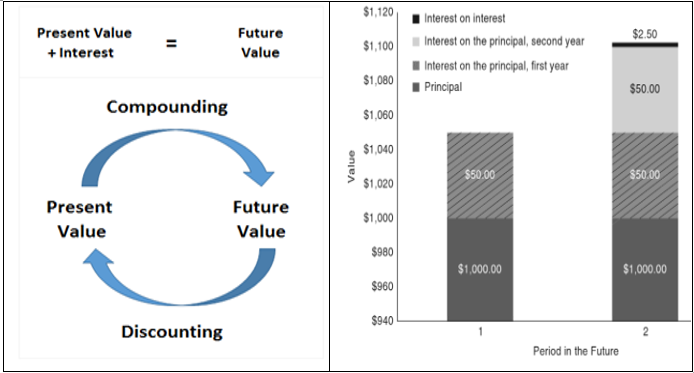
The financial transaction involves a value today into a value of the future as compounding effects, whereby discounting is translating a future value of the present. In short, the future value is the sum of the present value and interest (Drake & Fabozzi, 2009). For example, if a lender lent $1,000 today for two years and the interest is 6% compound interest rate, by the end of the second year lender need to repay $1,000 + interest. The repays amount repay will at the end of year two is $1, 123.60 (compounded effects. If the accumulation of the compounded effect of the end of 10 years, the lender needs to repay back $1, 790.85. This is an average annual repay to illustrate on a future value in table 3.    

Table 3. Source: Adapted from Drake Pamela and Fabozzi Franks, 2009. Foundation and Application of the Time Value of Money.

Measuring Corporate Wealth & Value Creation - The four key elements (Value Driver)
From the shareholder and financial perspective, the value is created when stakeholder generates revenues above the economic costs by generating the revenues. Value is only effective when revenues and retained earnings exceed all costs of capital employed (Koller T. , 1994). Some investor dependent on stable and predictable payout dividends which are typically mature blue-chip companies, as this value, accrues mostly to shareholders because they are the residual owners of the firm. 

For an instant, the company has to act on series of events it can influence. Firstly, in table 4 show the four actions linkage between corporate objectives and four categories of value drivers that were taught in class lecture. Secondly, it is through these drivers of value that the stakeholder leads the entire organization to establish a business strategy and the capital budgeting deployed and lay expectation to be accomplished (Institute of Management Accounts , 1997). Stakeholder identifies areas which will have the greatest impact on value chain and assign responsibility for their performance to individuals who can drive meeting its corporate targets. 

Table 4. Source: Adapted from Rappaport, 1986 and Institute of Management Accounts, 1997.

Shareholder creation refers to changes in the wealth of shareholders on a periodic on listed firms (quarterly/annual) basis. Changes in shareholder wealth are inferred mostly from changes in stock prices, dividends paid, and equity raised during the period. Since stock prices reflect investor expectations about future cash flows, creating wealth for shareholders requires that the firm undertakes investment decisions that have a positive net present value (NPV).

The value perspective is based on measuring value in the GAAP or FRA reporting structure. While the wealth perspective relies mainly on stock market information. For a publicly traded firm there are three concepts are identical when (1) CEO make announcement with all relevant information to capital markets, (2) credible source from the capital market institution like, Bloomberg, CNN, CNBC new, the wall street etc. (3) the markets believe and have confidence in management. 

 Financial Drivers of Total Shareholder Returns (TSR)
Total shareholder returns (TSR) concept is a useful summary measure for estimating the annual Rate of Return Net Assets (RONA) performance. The diagram below adapted from the IMA and BCG illustrates on table 5. A company’s TSR measure the annual RONA is split into three level of financial drivers with appropriate trade-offs among (1) profitability, (2) growth, and (3) free cash flows and to measure a unit’s contribution to the overall company capital gain and dividend yield to investors. Because it is possible that this return may be affected by overall capital market conditions rather than any specific decisions made by management, TSR typically is compared on a risk-adjusted basis with a peer group widely used benchmark (such as S&P500) for evaluating relative performance (IMA , 1997), table 6. This measure is based entirely on the market’s perceptions about a firm’s future performance. 

 Table 5. Source: Institute of Mgmt. Accounts (IMA), 1997. Boston Consulting Group, 1996

Table 6. Source: Bloomberg.com Amazon vs. S&P 500 and GM vs. S&P 500

1.    Problem Statements relating to shareholder value creation measurement

Stock Price
A change in the stock price, and consequently automatically attributed to management’s value-creation performance. However, there are some major problems with using the stock price as the only yardstick of managerial value-creation performance (Koller T. , 1994). The overall level of stock market prices may change simply because of macroeconomic conditions (e.g., interest rates, commodities futures uncertainty, recession, government introduce QE) would affect the prices of all stocks. These changes would have no relation to managerial value-creation performance.

Uncontrollable Factors
For example, a rise in oil price may increase the calculated economic value (EV) for any given time. Similarly, in periods of rising prices, there may be a tendency by management to overproduce in order to benefit from the rise in oil price and to show even higher EV. However, this implies that the firm has exercised the option of investing now rather than later.

Linkage Between Value- and Wealth - Creation Measures
Instantly stock prices reflect directly in the capital market expectations about the firm’s long-term value creation performance, it is not necessary that there be a one-to-one correspondence between current value-creation performance and wealth creation performance as reflected through changes in stock price (Koller T. , 1994). The value-creation measures reflect the periodic operational performance of management, whereas the wealth creation measures reflect the periodic change in investor wealth arising from changes in the market’s expectations due to management’s decisions during from time to time.

Case study - Using Fiat Chrysler Automobile (FCA) Shareholder value creation. Table 7.

Table 7. Source: Glen Arnold, Corporate Finance Management, 20113, Fifth edition. Page 622 


1.  Increase the Return on existing capital

FCA business unit is subjected to more intensive competition among the peers. To have advocated consolidation in the industry, it is characterized by significant R&D costs. FCA believes that sharing of 4% R&D costs among manufacturers, preferably through consolidation, will enable automakers to improve their return on capital employed (Fiat Chrysler Automobile , 2015).

When R&D readily launch a newly product introduction and successfully acceptable by the market, mass production greater contributions will continue to grow operating margins, and improve the revenue value chain. However, if FCA competitors are able to successfully integrate with its peers, it will increase competition and price pressure. FCA will then face challenges, the impact would be directly reflected in the FCA price-to-book ratio bottom-line results (Fiat Chrysler Automobile , 2015)

2.  Raise investment in positive spread business units
According to Bloomberg article published on April 26, 2016, FCA profit surged in the Q1, 2016 on demand for Jeep sport utility vehicles, while debt rose as the automaker spends to shift production away from sedans and hatchbacks. Despite the move would free up two plants for assembly (Ebhardt, 2016).

Adjusted EBIT nearly doubled to 1.38 billion euros ($1.56 billion) from 700 million euros a year ago, excluding profits from former unit Ferrari. Net industrial debt jumped to 6.59 billion euros from 5.05 billion euros at the end of 2015. FCA’s balance sheet was hit by foreign-exchange headwinds and upfront investments to increase production of pickups and SUVs. “The increase of debt is the negative news,” said Vincenzo Longo, strategist at IG Group in Milan. FCA shares fell 2.6% to 7.04 euros in Milan, extending the stock’s drop for the past 12 months to 31 percent.

3.    Divest assets (from negative spread units to release capital for more productive use)
Fiat Chrysler has reportedly scrapped plans to produce a new crossover based on the same platform as the 2017 Chrysler Pacifica minivan, Nevertheless, the announcement was not clear if the new crossover was to be a Chrysler vehicle only or if it would appear under the Dodge or Jeep banners. According to Fiat Chrysler Authority report published on May 18, 2016.

FCA CEO Sergio Marchionne has commented to that the Chrysler Pacifica’s platform could serve as the basis for the next-generation Chrysler 300 sedan, which will be a front all-wheel drive vehicle. it’s possible the sedan could be produced alongside the minivan at FCA’s Windsor Ontario assembly plant. The divest asset from negative spread on the vehicle’s sales performance would decide its fate as FCA extending the Caravan for a couple of more years and holding off plans on the crossover (Mceachern, 2015)


4.  Extend the planning Horizon
According to Reuter news published on Jan 26, 2016. FCA CEO Marchionne said earlier this month the world's seventh-biggest carmaker could still grow profits fivefold between 2013 and 2018, eliminate net debt and turn its Jeep, Alfa Romeo and Maserati brands into global forces. However, nearly halfway into the five-year plan, many analysts are skeptical if FCA will succeed to erase 7.85 billion euros (6 billion pounds) of debt and grow net profit to around 5 billion. "'Ambitious' is not really an adequate word to describe it, "said Bernstein's Max Warburton, who has an "underperform" rating on FCA stock. Despite Marchionne said that FCA's performance last year came in at the top end of its own forecasts, which included an adjusted net profit of 1.2 billion euros - a long way from the 2018 target (Flak, 2016).

5.  Lower the required Rate of Return
Based on FCA annual report 2015, page 14 and 103. FCA has announced its profitability and key success depends on vehicle sales volumes. If the vehicle sales deteriorate, particularly sales of its pickup trucks, larger utility vehicles and minivans, our results of operations and financial condition will suffer. A typical automotive manufacturing has significant fixed costs and, therefore, changes in vehicle sales volume can have a disproportionately large effect dilute profitability and earnings (Fiat Chrysler Automobile , 2015). For example, assuming constant pricing, mix, and cost of sales per vehicle, that all results of operations were attributable to vehicle shipments and that all other variables remain constant. Therefore, a 10% decrease in 2015 vehicle shipments would reduce the (“Adjusted EBIT”).  

In addition, our profitability in the U.S., Canada, Mexico and Caribbean islands (“NAFTA”), a region which contributed a majority of our profit in 2015, is particularly dependent on demand for our pickup trucks, larger utility vehicles and minivans (Fiat Chrysler Automobile , 2015). For an instant, a shift in demand away from these vehicles within the NAFTA region, and towards in response to higher fuel prices or other factors, could adversely affect the profitability margin by reduced the Group’s Adjusted EBIT would lower the rate of required rate of return. This estimate may not take into account any other changes in market conditions or to shifting consumer preferences, including production and pricing changes.

Generally, the automotive sector has historically been subject to highly cyclical demand and tends to reflect the overall performance of the economy. In addition to slow economic growth or recession, — such as increases in energy prices and fluctuations in prices of raw materials or contractions in infrastructure spending—could have negative consequences for the industry and the effects of financial condition would result in lower the require rate of return.

Summary of learning.
This chapter has given a wide perspective on the concept of understanding and evaluation of the value management failings of traditional measures of wealth generation. Articles from various resources have a direct correlation to the four key elements (Value Driver) and the five actions from the real world case studies approach - Using Fiat Chrysler Automobile (FCA) Shareholder value creation as an example has an enormous impact in the class learning experience.     

References

1.  Arnold, G. (2013). Corporate Financial Management . Person.

2.  Damodaran, A. (2011). The little book of valuation. WILEY.

3.  Drake, P., & Fabozzi, F. (2009). Foundations and Application of the Time Value of Money. WILEY.

4.  Ebhardt, T. (2016, April 26). Fiat Chrysler's Jeep-Led Profit Surge clouded by Higher Debt. Bloomberg.

5.  Edmans, A. (2011). Does the stock market fully value intangibles? Employee satisfaction and Equity Price. ELSEVIER.

6.  Fiat Chrysler Automobile . (2015). Annual Report

7.  Flak, A. (2016, Jan 26). Fiat Chrysler fights to keep turnaround plan on the road. Reuters.

8.  Frederikslust, R., Ang, J., & Sudarsanam, P. (2008). Corporate Governance and Corporate Finance. Routledge.

9.  Institute of Management Accounts . (1997). Measuring and Managing Shareholder Value Creation.

10.        Jacobs, M., & Shivdasani, A. (2012). Do you know your cost of Capital? Harvard Business Review.

11.        Koller , T. (1994, August). What is Value-based Management? McKinsey&Company.

12.        Mauboussin, M., & Rappaport, A. (2016, July 01). Reclaiming the idea of shareholder value.

13.        Mceachern, S. (2015, May 18). Fiat Chrysler Scraps Plans To Build Chrysler Pacifica Based Crossover. FIAT Chrysler Authority.

14.        PWC. (2013). Correcting the course of capital projects.

15.        Rappaport , A. (2006, From the September Issue). Ten ways to create shareholder values. Harvard Business Review.